One GPU server, many people, no VRAM fights
- Go
- Infrastructure
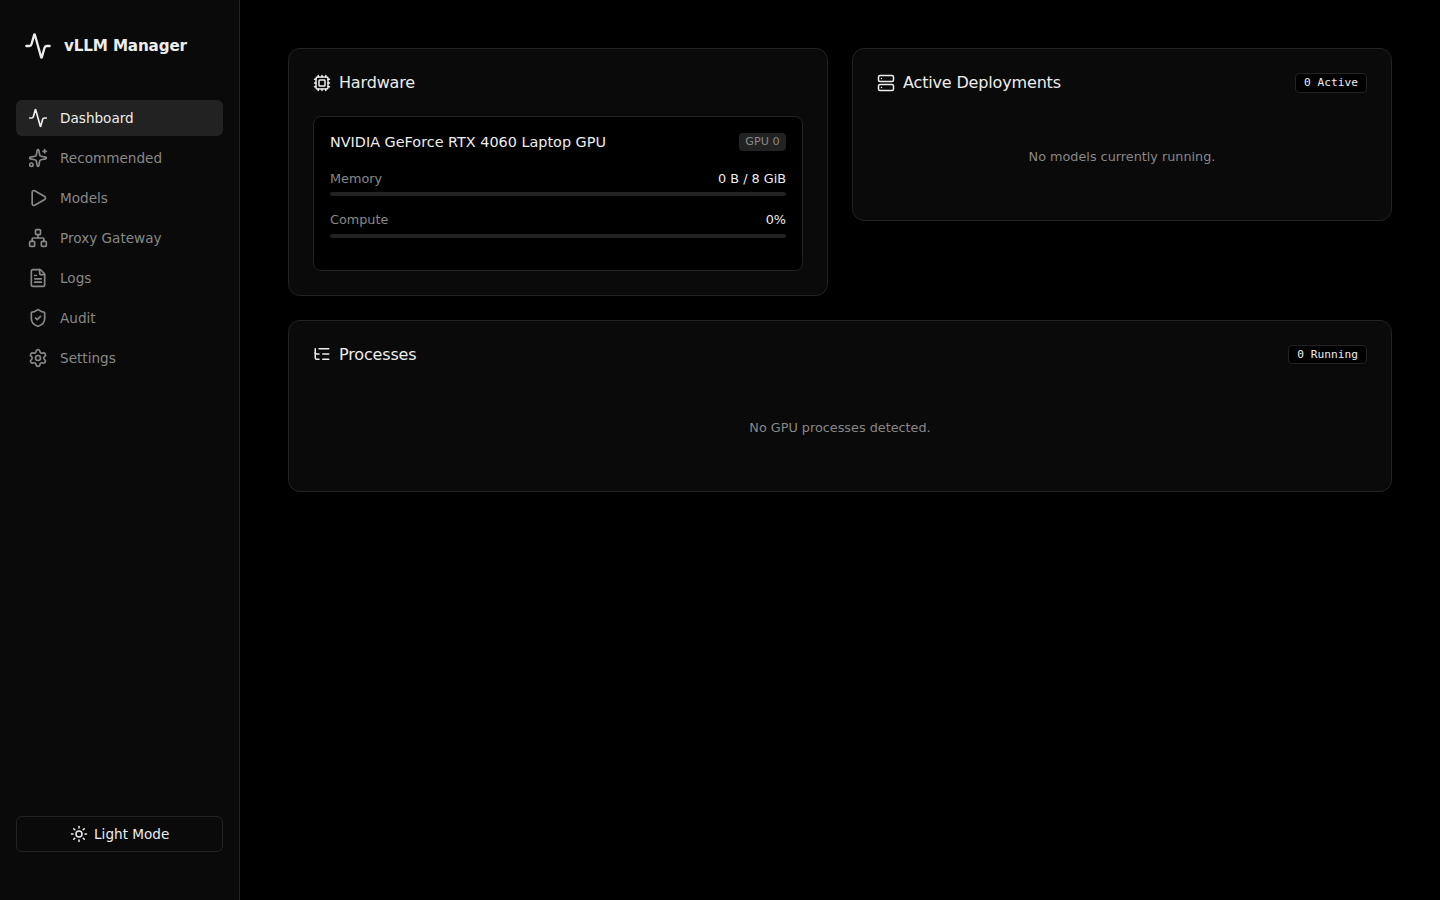
vLLM GPU Manager is a tool for running large language models on a shared GPU server. It deploys models as Docker containers, checks that they will fit in VRAM before launching, routes all of them through one authenticated port, and gives the team a web console so they don't need server access. It started as a bash script. This post is how it got from there to here.
Where it started: a shared GPU and Ollama
I work as a student researcher in a security research lab at NUS, mostly on cyber risk assessment and LLM red teaming. The lab has a lot of infrastructure for students to test things on.
For one of my projects I needed LLM API access, and I didn't want to depend on publicly hosted APIs. I asked the team if I could get access to a GPU with a model on it, and they gave me a beefy one: a server with two NVIDIA H100 NVL GPUs, 188 GB of VRAM in total. The two GPUs are linked with NVLink, so one large model can be split across both.
People were using that GPU through Ollama, which was not suited for this case. By default it serves one request at a time, so multiple people sending requests is a problem. That GPU was also too good for it.
Seeing that infrastructure felt like an opportunity to learn about serving models and inference properly. I looked into inference engines and found vLLM, which is used in production and allows a lot of customization. It let multiple people run multiple models at once on that GPU. There were other options at the time, but I was trying to learn, so I went with it.
Stage 1: a bash script
The first version was a bash script that ran vLLM commands. Before writing it I decided to run the models in Docker containers, for isolation. Models come from Hugging Face and we don't know whether they can be trusted. It is basic isolation from the host, not a hardened sandbox.
The script was mostly about understanding how vLLM works and whether we could serve models at all. That is how I learned how many parameters vLLM has. If you want to run several models, you don't want one of them taking the whole GPU, so you set memory utilization, context length and a lot of other things.
Two problems showed up.
Only I had access to the server. Everyone else got an IP address and a port and were told the models were running there. Starting a model, stopping it, checking on it and reading the logs all depended on me.
People asked for numbers the GPU couldn't give. Someone would set a very large context length on a model that doesn't support it, or that the GPU can't hold, and the launch would fail with an error.
Stage 2: checks before the launch
I handled the second problem with a check before every launch.
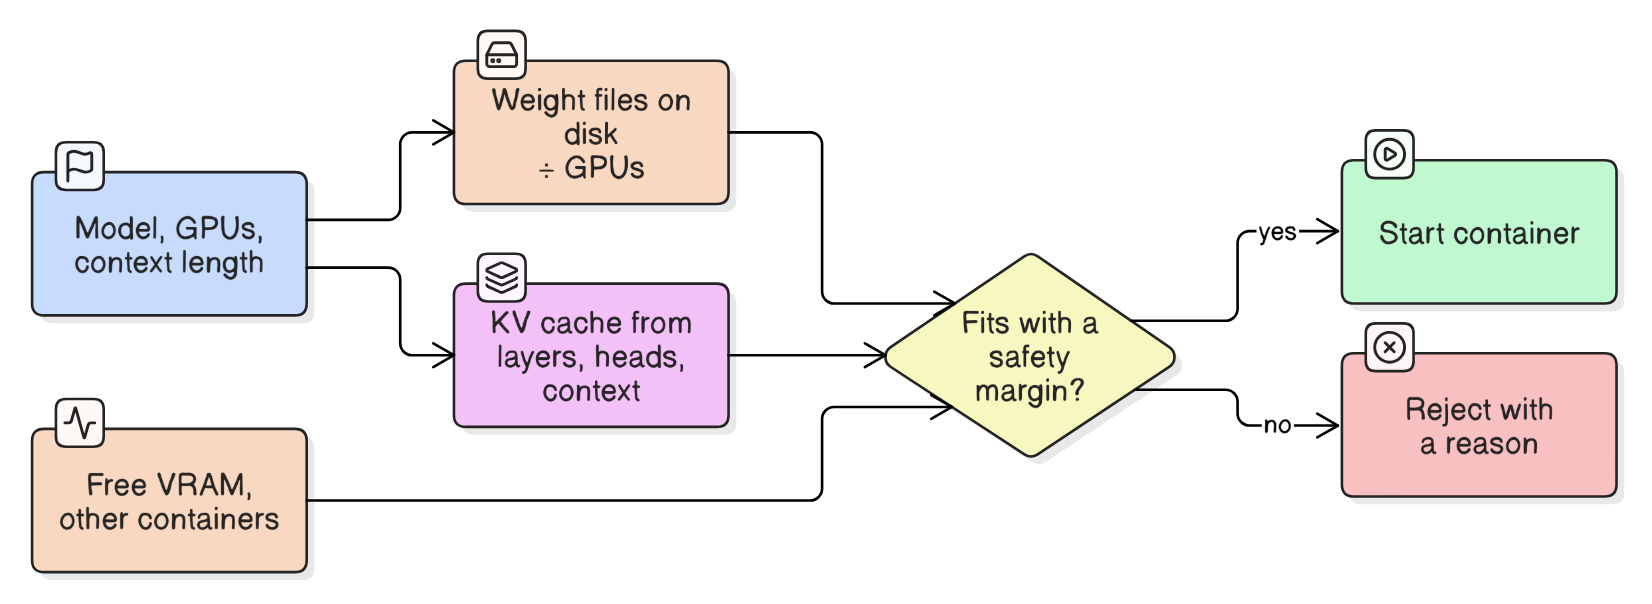
Before a model launches, the manager works out what it will need. It reads the model's own config for the number of layers, heads and head dimension, scans the weight files on disk for their size, and from that estimates the weights per GPU and the KV cache for the context length you asked for. It then checks what is actually free on the GPU, accounts for other containers sharing it, and leaves a safety margin. If it doesn't fit, you get an error explaining why instead of a crash.
For the first problem, I added log streaming, so people could see what a model was doing without server access. Fully solving it took the UI in the next stage.
Stage 3: from bash to Go, with a UI
Then I decided to rewrite it as a Go program. I started with the UI, since Go can embed the files and it didn't need to be a heavy GUI application. I added the CLI afterwards and still keep the GPU CLI capabilities in the program, so people comfortable with a terminal can use it that way, and people without server access can use the console.
Most of what the UI does is also in the CLI: GPUs, models, the cache, settings and downloads. The proxy users and routing are UI-only.
I also added downloading models from Hugging Face inside the app, instead of running a command on the server.
Importing a recipe
There is a part of the UI I'm proud of. vLLM has a recipes site where each model comes with a ready-made docker run command. You click Import Command Recipe, paste that command, and the manager reads it and fills in the deploy form: the model, the port, tensor parallel size, context length and so on. I don't want people bothered by the parameters. The form shows the ones I think are necessary, with advanced settings for people who want more, and a way to pass extra vLLM flags.
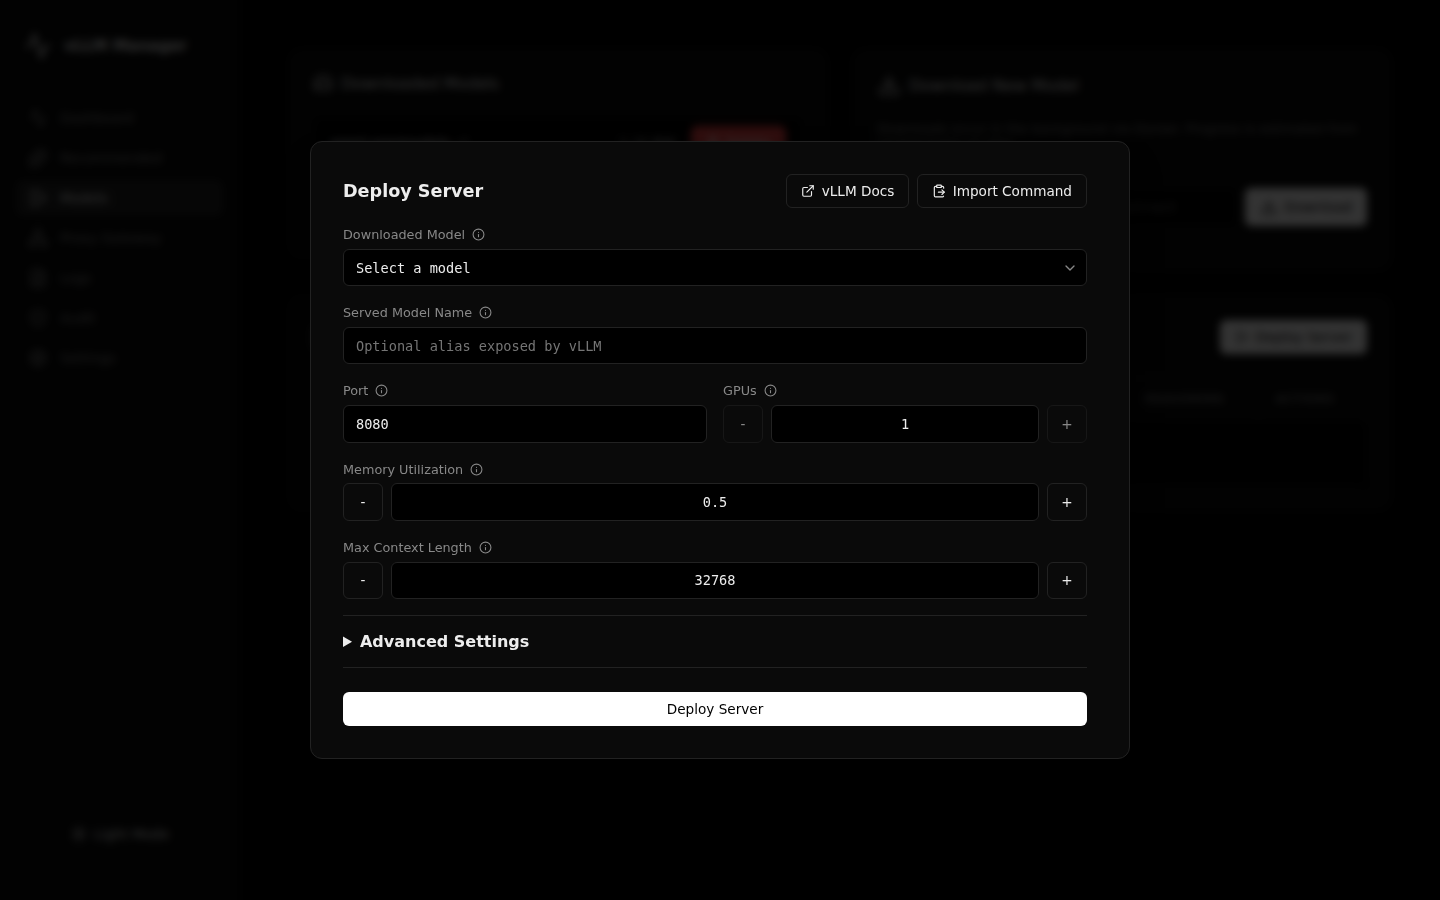
That last part is an allowlist, and the server checks it when a model launches, not just at the import box. 29 extra vLLM flags are allowed, for example --chat-template, --max-num-batched-tokens and --enforce-eager, and anything else is rejected. Docker flags that would change what the container is allowed to do (--privileged, --network, --entrypoint, --mount, --cap-add, --device, --pid, --user, --security-opt and --restart) are dropped on import, with a warning that the manager owns the Docker security settings. A pasted command comes from outside, and I don't want a copied recipe to quietly give a container more power than the manager would.
Stage 4: one port instead of many
Then came the proxy. The project was deployed in a private network, and the problem with those is that the private IPs are reachable by anyone already inside. They can scan, see an open port and send requests. They may not learn the model details, but still. The team didn't want a lot of network rules for a private deployment, so I built it both ways, with and without the proxy.
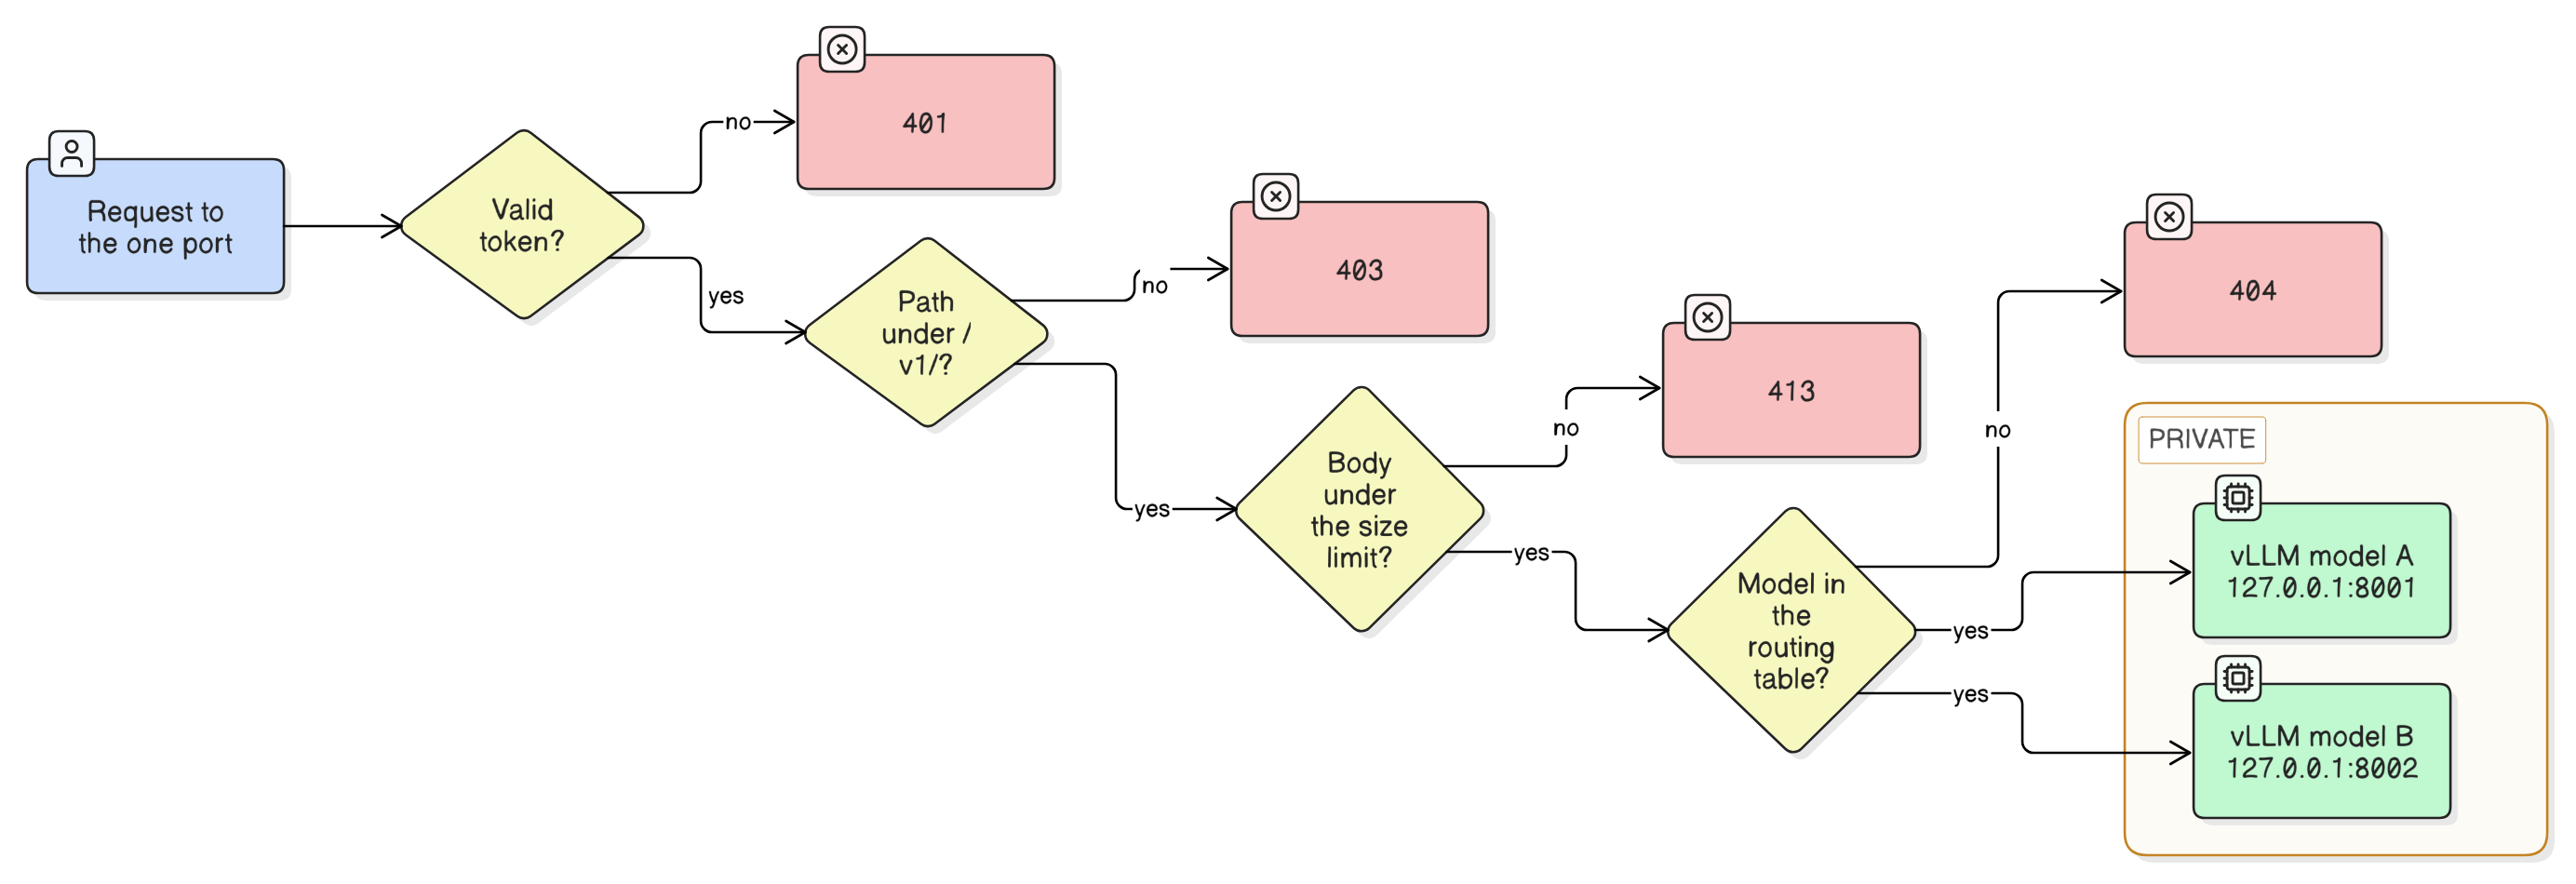
In proxy mode the Go program opens one port and handles all the traffic. It routes each request by the model name in it, so we could run two or three models without opening a port per model. The vLLM servers themselves bind to localhost. Along with the proxy I added authentication, so only users with a token get through. The proxy also only accepts the OpenAI-style /v1/ paths, caps the body size, and returns a 404 for a model name that isn't in its routing table.
Stage 5: monitoring
The last thing I wanted to get right was monitoring. vLLM already exposes metrics on the same port a model serves on, so the data was there. The problem was telling Prometheus that a new model exists, because nobody wants to edit a Prometheus config every time a model starts.
So I didn't touch that config. Prometheus can read its targets from a file and notice when the file changes, so I pointed it at one file and let the manager own it. Whenever a model is started, stopped or removed, the manager looks at the running vLLM containers and rewrites the file. Each running model becomes one target, with labels for the model name, port, bind IP and container, so a Grafana graph tells you which model it belongs to. Prometheus refreshes every 5 seconds. The manager writes a temporary file and renames it, so Prometheus never reads a half-written one.
When a model stops its target is removed, but its history stays. The setup script also runs NVIDIA's DCGM exporter for GPU memory and utilization, and downloads two public Grafana dashboards at pinned versions, one for the GPU and one for vLLM. Grafana is the only service exposed on the network IP you choose. Prometheus and the exporter listen on 127.0.0.1 only. The history lives in Docker volumes that the manager never deletes on its own.
The monitoring has run in the background since, and I haven't seen any irregular patterns. If anyone on the team wants to know the load, memory or temperature, they open Grafana.
Where it is now
Three other people on my team use the web app besides me, to deploy models and set the parameters themselves. As the saying goes, necessity is the mother of invention. It started because I needed model access, and it grew whenever something was awkward for the team. The code is at github.com/Vulcanite/vllm-gpu-manager.
I dictated this post with Wispr Flow. Claude cleaned up the text and checked the technical details against the code, and I reviewed it before publishing.